Mani Ganesh1,2,
Abidov Sh Aziz1,
Mei Mei Peng1,
Ramaswamy Ravikumar1,
Kalaimani Sakthimanigandan2,
Seung Eun Cha3,4,
Hyun Tae Jang1 ![]()
For correspondence:- Hyun Jang Email: htjang@hanseo.ac.kr Tel:+82416601423
Received: 15 July 2015 Accepted: 28 January 2016 Published: 31 March 2016
Citation: Ganesh M, Aziz AS, Peng MM, Ravikumar R, Sakthimanigandan K, Cha SE, et al. Evaluation of tropaeolin 000-1 as a colorimetric reagent for assay of duloxetine and escitalopram in solid dosage form. Trop J Pharm Res 2016; 15(3):613-621 doi: 10.4314/tjpr.v15i3.25
© 2016 The authors.
This is an Open Access article that uses a funding model which does not charge readers or their institutions for access and distributed under the terms of the Creative Commons Attribution License (http://creativecommons.org/licenses/by/4.0) and the Budapest Open Access Initiative (http://www.budapestopenaccessinitiative.org/read), which permit unrestricted use, distribution, and reproduction in any medium, provided the original work is properly credited..
Purpose: To explore the application of tropaeolin 000-1 reagent for the rapid, precise and accurate determination of duloxetine hydrochloride (DX) and escitalopram maleate (ECT).
Methods: Determination of DX and ECT was based on the formation of complexes between the dye, DX and ECT in 0.1 M HCl. The resulting chromogen showed a maximum wavelength of absorption at 502 and 503 nm for DX and ECT, respectively. This method was validated for analytical parameters such as linearity, precision, accuracy, robustness, and ruggedness according to the guidelines of International Conference on Harmonization (ICH) and United States Pharmacopoeia (USP).
Results: The absorbance of the each chromogen formed with DX and ECT was linear over the range of 4 - 30 and 2.5 - 27.5 µg mL-1 for DX and ECT, with 0.9968 and 0.9979 as the regression coefficient, respectively. The limits of detection (LOD) were 0.0045 and 0.0015 μg mL-1 for DX and ECT, respectively, with the limits of quantification (LOQ) at 0.5 and 0.08 μg mL-1. The recovery (accuracy) of the methods resulted in low RSD values of 0.856 – 0.983 % for DX and 0.765 – 0.987 % for ECT.
Conclusion: The developed method shows a high degree of accuracy and precision for the determination of DX and ECT. Thus, tropaeolin 000-1 reagent is versatile for determining the contents of DX and ECT in their formulations.
Introduction
Acid dyes such as methyl orange and bromocresol green are ideal reagents for the extractive colorimetric determination of various nitrogen-containing pharmaceuticals. The maximum wavelength that can be used to examine such drugs with methyl orange and bromocresol green ranges from 410 to 415 nm, and these compounds experience interference with material that have UV absorption, such as certain preservatives and diluents present in solid dosage forms. Other commonly used colorimetric reagents require specific functional groups such as primary amine, phenolic, and aldehydic groups, which makes methods that use them more laborious than extractive colorimetric procedures [1-4].
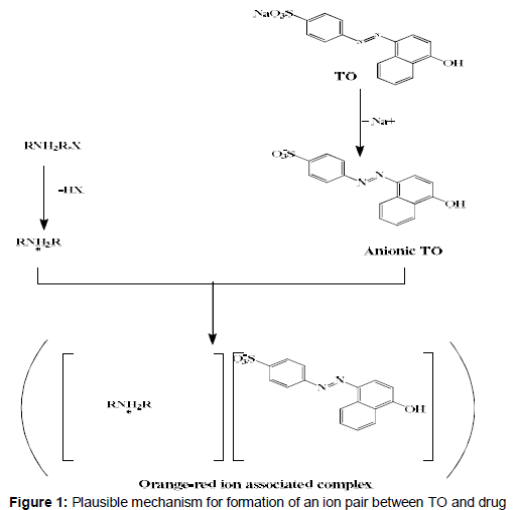
Tropaeolin 000-1 (TO), or α-naphthol orange, has been identified as a useful extractive colorimetric reagent for the estimation of pharmaceuticals [5]. The sulfonic acid group of TO that forms in the presence of acid can combine with pharmaceuticals containing basic nitrogen (positively charged groups). A plausible mechanism for the formation of color is provided in . This is the first step in the ionization of the dye, as well as the positively charged drug, in the presence of acid or buffer media. The molecules then combine to form a single species of colored chromogen. In this study, we selected DX and ECT to examine the versatility of TO in estimating drugs in their dosage forms.
Duloxetine hydrochloride (DX) has the chemical formula (+)-(S)-N-methyl-3-(1-naphthalenyloxy)-2-thiophene propanamine hydrochloride. It is a selective serotonin and nor-epinephrine re-uptake inhibitor that was recently approved by the United States FDA. This compound can be used for the treatment of major depressive disorders (MDD) and diabetic peripheral neuropathic pain [6,7]. Previous studies on analytical methods for DX estimated its concentration using chromatographic, UV spectrophotometric, or colorimetric methods [8-14].
The second drug examined, escitalopram oxalate (ECT), has the chemical formula S (+)-1-[3-(dimethyl-amino) propyl]-1-(p-fluorophenyl)-5-phthalancarbonitrile, and is a highly active S (+) enantiomer of citalopram. It is also an orally administered selective serotonin reuptake inhibitor (SSRI) prescribed for depression, panic, premenstrual dysphoric, and obsessive-compulsive disorder [15,16]. Methods such as chromatographic, spectrophotometric, colorimetric, and extractive colorimetric estimation using bromocresol green and methyl orange have been used in pharmaceutical and biological matrices [17-20].
Extractive colorimetric procedures are popular because of their sensitivity and selectivity toward the active component of interest. Due to the ease of these methods, they can be used for the quantitative determination of many pharmaceuticals. Up to now, there have been no reports on the estimation of duloxetine HCl and escitalopram oxalate using TO as an ion-pairing agent. In the present study, we report a simple, accurate, and precise extractive colorimetric method for the estimation of DX and ECT; its suitability was validated for assaying DX and ECT contents in their respective formulations.
Methods
Materials
Standard duloxetine HCl (DX) and escitalopram oxalate (ECT) were obtained from Sigma Aldrich GmbH (Germany), tropaeolin 000-1 was purchased from TCI Chemicals (Japan), and methyl orange, chloroform, and other chemicals were from DaeJung Metals and Chemicals, Korea.
Instrumentation
Shimadzu UVmini-1240 UV-Visible spectrophotometer and Scinco Neosys-2000 DRS-UV systems were used with 1-cm quartz cells for spectral measurements along with Shimadzu UV Probe software (version 2.1).
Preparation of drug stock solutions
Stock solutions of 1 mg mL-1 of standard drugs were prepared by dissolving 100 mg of DX or ECT in 100 mL of water using volumetric flasks. Working standards were prepared by suitably diluting the standard stock solutions.
Sample preparation
Aliquots of secondary stocks were transferred into a series of 50-mL separating funnels, after which 2 mL of aqueous solution of 0.2 % (w/v) TO reagent were added. The mixtures were shaken well, and 6 mL of 0.1 M HCl was added and mixed. The orange-red chromogen that formed was extracted using 10 mL of chloroform. To absorb the water present in the organic layer, it was passed through dried anhydrous sodium sulfate (2 g) in a cotton-plugged funnel.
Absorbance and linearity determination
Full-scan absorption spectra of both colored ion-pair complexes were acquired by scanning the chloroform layer of the chromogen from 370 to 800 nm against a reagent blank prepared by the same procedure by omitting the drug.
Analytical method optimization
Several experiments were performed to optimize conditions and obtain quantitative orange-red ion-pair complexes. Method validation was performed based on USP [21] and ICH [22] guidelines. The optimization experiments revealed that the reproducible formation of the orange-red ion pair required 6 mL of 0.1 M HCl. Various solvents were tested for extraction; chloroform was found to perform best. The same conditions are recommended for the extractive colorimetric estimations of other pharmaceuticals [13,14,20].
LOD and LOQ of the method
The lowest possible quantity of drug detectable by the developed procedure is called the limit of detection (LOD), and the lowest possible quantity of the drug that can be used in the estimation or assay of the drug is called the limit of quantitation (LOQ). These levels were established as in Eq 1.
LOD or LOQ = ĸ SD a/b …………………….. (1)
where ĸ = 3 for LOD and 10 for LOQ, SD is the standard deviation of the intercept (a), and b is the slope.
Method precision
The precision of the method was estimated by examining the intra-day and inter-day precision, both of which express the closeness of agreement between a series of results or measurements under specified conditions. Six-fold replicate analyses on each sample were used to examine method repeatability. Intra-day precision was performed on the same day at different time intervals. Inter-day precision was established based on the results of the same sample examined on five consecutive days.
Method accuracy
Accuracy is the degree of agreement between the results determined by the method and the true value. A standard spiking procedure was followed to determine the accuracy by spiking a known quantity of standard into the pre-analyzed assay sample, and estimation of the results was performed using the method.
Assay of formulations
Twenty tablets of each drug were weighed separately and then ground to fine powder separately, and the average tablet weight was calculated. A quantity of powder required for specific dilution of the particular drug was accurately weighed and transferred into a 50-ml volumetric flask. A small amount of water was added and the mixture was sonicated for 5 min to dissolve the drug, after which the final volume was created by adding water up to the mark. The final solution was filtered to remove insoluble excipients using a 0.45-µm membrane filter.
Study of placebo interference with the proposed method
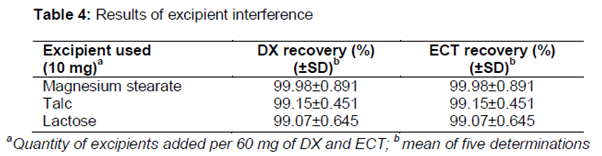
It is necessary to evaluate the effect of the placebo during analytical method validation since excipients present in the formulation may interfere with estimation of the drug. To study this, common excipients such as magnesium stearate, talc, and lactose were examined. A defined quantity of each of the above excipients was mixed with 60 mg of DX and ECT, and the method was followed. The percentage recovery of the drug from the excipients was calculated [21].
Bench-top stability of chromogen
Stability is an important parameter for colorimetric procedures. To study the stability of the color formed by the ion pairs, a specified quantity of stock was mixed with constant quantities of TO and HCl, the mixtures were held for varying times to complete the reaction, and the mixtures were extracted with chloroform. The absorbance of chromogen was measured at various time intervals and plotted as a graph of time vs. absorbance.
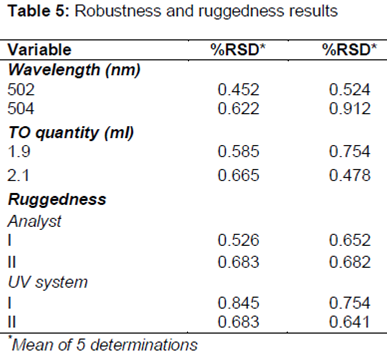
Robustness and ruggedness
To study the effects of deliberate changes in the method, defined as the robustness of the method, changes in the wavelength of estimation and the quantity of the dyes were considered. Likewise, inter-analyst and inter-instrument variations were analyzed to study ruggedness. Ruggedness was documented by determining the drug in the marketed formulation using two different spectrophotometers, a Shimadzu UVmini-1240 (system I) and a Scinco Neosys-2000 DRS-UV with liquid sample analysis ports (system II), and two different analysts.
Effect of TO concentration and quantity
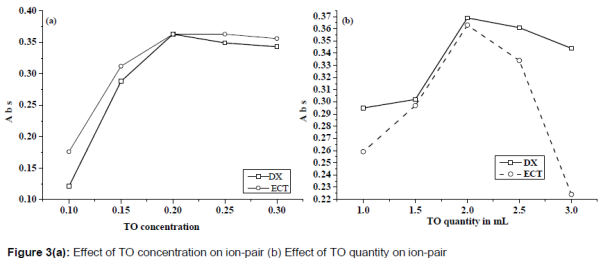
To validate the effect of TO concentration on the effective formation of chromogen, we measured the absorbance of solutions containing fixed concentrations of DX and ECT with 0.5 mL of solutions with various concentrations (0.10 – 0.30 % w/v) of TO.
Statistical analysis
Origin 8 statistical and graphical software was used for deriving regression equations and linearity curves. Microsoft Excel 2007 software was also used to calculate means and standard deviations. Student’s t-tests and F-tests were performed using SPSS version 10.0 (SPSS inc, Chicago, IL, USA).
Results
Upon hydrolysis, TO became anionic and formed a bright orange-red complex (charge transfer complex) with the cationic nitrogen present in DX and ECT. After formation of the ion-pair complex, the dye and drug act as a single molecule and the force stabilizing this single unit is electrostatic in nature, as stated in the mechanism ().
Absorbance
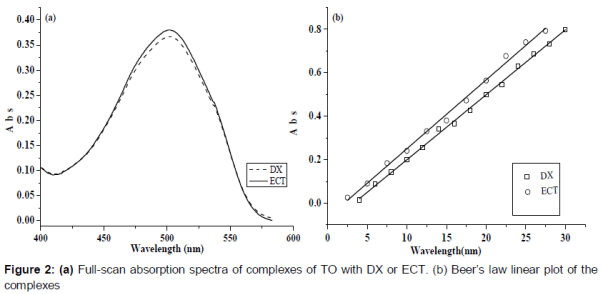
Full-scan absorption spectra are illustrated in (a). Based on the figure, the maximum absorbance wavelengths (λmax) for DX-TO and ECT-TO are 502 and 503 nm for DX and ECT, respectively. Each λmax was used for further studies on the estimation of DX and ECT in bulk and marketed formulations.
Method validation
Linearity and range
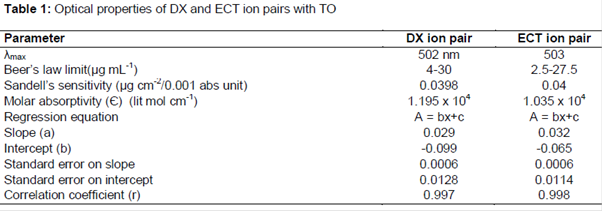
The Beer’s law limit, molar absorptivity, and λmax were determined, and the results are provided in (b) and . To determine the Beer’s law limit, a calibration curve was constructed by plotting absorbance against concentration ((b)), and regression was calculated using Eq 2.
A = bX - C ………………………………. (2)
where A is the absorbance of the chromogen formed with DX or ECT, X is the drug concentration in μg mL-1, and r is the correlation coefficient. Other optical parameters such as molar absorptivity (Є) and Sandell’s sensitivity were also determined and are presented in .
LOD and LOQ
The LODs of DX and ECT were determined as 0.0045 and 0.0015 μg mL-1, respectively, and the LOQs for DX and ECT were found to be 0.5 and 0.08 μg mL-1.
Assay of the drugs in their formulations
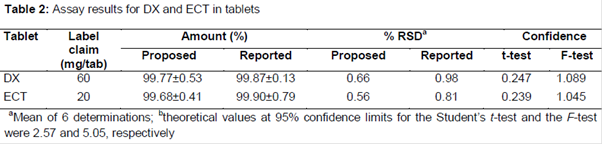
Mean recoveries were 99.8 ± 0.87 and 99.55 ± 0.75 % for bulk DX and ECT, respectively, relative to the label claim. For use of the proposed method with the drugs in their formulations, market-procured tablets were subjected to analysis for their contents of DX and ECT based on the proposed method and previously reported methods [13,20]. The assay results for the marketed formulation of DX and ECT by the proposed and reported extractive colorimetric methods were found to be 99.77 % (99.87 % based on the reported method) and 99.68 % (99.9 % based on the reported method) for DX and ECT, respectively, relative to the label claim for each tablet. These results were compared using statistical analyses with the Student’s t-test and F-test. No significant differences were observed between the calculated and theoretical values using the Student’s t-tests and F-tests at the 95 % confidence level, suggesting that the present method is comparable with the reference methods ().
Method precision
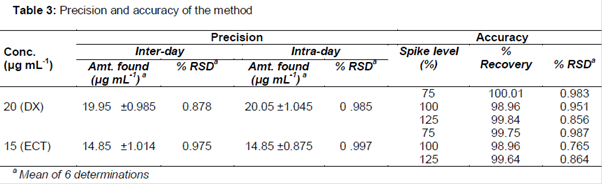
Method precision results are provided in . The percentage relative standard deviations (% RSD) for inter-day precision were low, at about 0.878 and 0.975 for DX and ECT, respectively. Likewise, the intraday precision % RSD values were 0.978 and 0.997 for DX and ECT, respectively. These results are suggestive of good repeatability (precision) of the method.
Accuracy
The results of recovery studies are provided in . The mean % RSD for determinations at three levels were 0.856 – 0.983% and 0.765 – 0.987% for DX and ECT, respectively. These were within the acceptance limit for accuracy based on standard guidelines for analytical method validation (< 2 % RSD).
Effect of TO concentration and quantity
Results of range studies are depicted in (a). The figure shows that 0.5 mL of 0.2 % w/v TO provides a satisfactory maximum absorbance with both drugs; hence, the same concentration was chosen as a suitable concentration for optimal ion-paring. To study the effect of TO quantity on the intensity of the chromogen formed, various amounts of TO (1 – 3 mL) were mixed with the standard drug solutions described above. As shown in (b), 2 mL of 0.2 % w/v TO was sufficient to form a complex with maximum absorbance at the particular wavelength of estimation.
Placebo interference
The effects of placebo interference testing are presented in . None of tthe excipients studied were found to interfere in the estimation of either drug. Likewise, a placebo mixture of the excipients did not result in any color in the extract in the present method.
Effect of 0.1 M HCl quantity
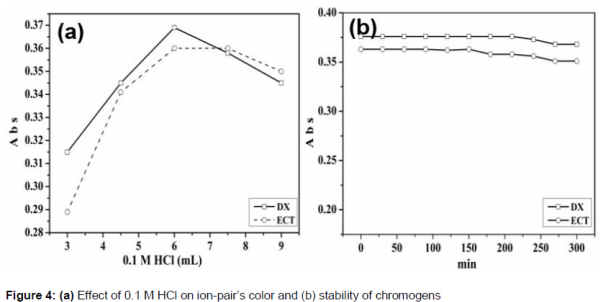
To explore the effect of the quantity of HCl on the intensity of the resulting chromo, various amounts of 0.1 M HCl (3 – 9 mL) were mixed with the above optimized concentration of dye into drug solution, and the intensity of chromogen formed was analyzed ((a)). We found that about 6 ml of HCl, as stated previously, provided a satisfactory chromogen intensity.
Bench-top stability of chromogen
Plots of color intensity developed by the chromogen formed over time were constructed for each drug. The plots ((b)) show that the chromogens formed are stable for 3.5 h. Subsequently, the color intensity decreased.
Robustness and ruggedness
The results obtained for robustness and ruggedness () are within the recommended 2 % RSD for validation procedures given in the ICH guidelines.
Discussion
The azo dye TO is negatively charged because of the disassociated sulfonate group [SO3 ], which forms an ion complex with positively charged drugs with a quaternary nitrogen in their structure, such as DX and ECT. These oppositely charged TL and TO ions form a stable single ion pair of a drug-TO complex by the electrostatic force of attraction.
The maximum absorbances of the orange-red ion-association complexes of DX and ECT were recorded at 502 and 503 nm, respectively. The absorbances of the complexes obeyed Beer's law over the ranges of 4 – 30 and 2.5 – 27.5 µg/mL, respectively, for DX and ECT, with correlation coefficients of 0.997 and 0.997. The percentage recoveries (99.84 – 100.1 and 98.96 – 99.75 %, respectively, for DX and ECT) and method precision values were comparable with those of previously reported methods [13,20].
Conclusion
The proposed extractive ion-pair colorimetric estimation method for duloxetine (DX) and escitalopram (ECT) in bulk and in their solid dosage form using tropaeolin 000-1 dye as a colorimetric reagent is sensitive, specific (selective), rapid, and cost-effective. The method is specific to the drugs duloxetine and escitalopram, as it is free from interference by common excipients that are chosen in the study. Because the method utilizes simple reagents at low concentrations, it is more cost-effective than other time-consuming and laborious analytical methods. Thus, the method described here is suitable for the routine quantitative determination of the drugs DX and ECT in bulk and in their formulations.
Declarations
Acknowledgement
References
Archives


News Updates